We commissioned Focaldata to create a new segmentation to reflect the changing issues of focus. The six segments below offer a picture of public attitudes to multiculturalism today. The methodology used to create the 2024 segments is as close to the original 2011 method as possible, incorporating previously asked questions with new questions relating to newly salient issues.

Multiculturalists
The largest segment, making up almost a quarter of the overall sample, the Multiculturalists reflect the finding from previous Fear and HOPE reports that many people’s attitudes towards immigration, multiculturalism and also LGBTQ+ and religious groups are more tolerant. Members of this segment span the age range fairly evenly, but they are more likely to have degree level or above qualifications and they are slightly more likely to be based in Greater London and the South East.
Multiculturalists are positive not only about immigration and multiculturalism, but also about Muslims, other religious minorities and the LGBTQ+ community. For example, 79% agree that most Muslims have integrated successfully into wider British society (average 50%) and 64% think that people should be able to identify as a different gender as one they were assigned at birth (average 41%). They are consistently less likely than average to think religious minorities and LGBTQ+ people cause problems.
Members of this group are middling in political distrust/pessimism scale. They are slightly more likely than average to have voted in the 2024 election: half of them think that at least one political party represents what they think, in line with the sample average. They are more optimistic than other segments, but overall do not feel confident about the future: 44% think things will be better for Britain in 10 years’ time (average 30%) and 48% think things will be better for themselves (average 37%).
Hyper-progressives
This smaller segment has positive beliefs about multiculturalism and immigration. However, they are also more likely to have negative views of religious minorities, specifically Jews and to some extent Hindus. Hyper-progressives are more likely on average to be accepting of LGBTQ+ people, including trans people, but are slightly more likely to believe Hindus cause problems in the world (24% vs. 18%), but not in the UK.
However, this segment is much more likely to believe Jews cause problems, both in the UK (28% vs. 15%) and in the world as a whole (49% vs. 29%). The Israel-Palestine conflict has a part to play in this, as Hyper-progressives are more likely to believe that pro-Israel campaigners cause problems (56% vs. 47%), and less likely to believe the same about pro-Palestine campaigners (30% vs. 52%). This suggests a conflation between Judaism and Israel’s role in the conflict. They were twice as likely to vote Green (9% vs. 4%) and Independent (4% vs. 2%) which could be related to pro-Palestine candidates. This suggests that members of this segment have an international approach to identity and politics.
Two thirds of this segment are female and they are more likely to be non-religious of any segment (57% vs. 45%). Muslims are also slightly overrepresented in this group. Hyper-progressives were also more likely than average not to have voted in the last general election (46% vs. 35%), and they were more likely to vote in protest or tactically. This reflects a wider pessimism and political disconnection. 91% of this segment believe that politicians don’t listen to people like them, and 93% agree that the political system is broken. When it comes to themselves and their families, 51% believe that their lives will be worse in ten years’ time.
Cherry-pickers
Members of this segment have broadly positive beliefs about multiculturalism and immigration and high levels of trust and optimism in society. 63% agree that discrimination is a serious problem for Muslims in Britain, 54% agree that the media is too negative towards Muslims (average 37%) and they are less likely to say that having a wide variety of backgrounds and cultures has undermined British culture (19% vs. 44%).
Somewhat paradoxically, however, they also tend to have negative views of non-Muslim groups. For example, they hold higher-than-average negative views about Hindus – 29% agree they cause problems in the UK (average 16%), and Sikhs – 24% agree that they cause problems (average 14%). They are also more likely than average to think that lesbian, gay and bisexual people cause problems in the UK (32% vs. 23%). This suggests that views about multiculturalism and diversity more broadly are focused around the Muslim experience for many, and intra-ethnic tensions across the South Asian diaspora in particular could be an interesting dynamic within this segment.
Their optimism about society is some of the highest of the sample: 55% think life will be better for themselves and their families in 10 years’ time (average 37%) and 49% think life will be better for the UK as a whole (average 30%). However when it comes to political representation they are neither optimistic nor pessimistic, responding on the fence to a number of questions on politicians and the political system.
The Cherry-pickers skew much younger, with 18-34 year olds overrepresented. 42% of Cherry-pickers have degree level or above qualifications, compared to an average of 33%. There is also much greater ethnic diversity in this segment – only 69% are white compared to 87% of the whole sample, with 18% coming from an Asian or Asian British background and 9% from a Black or Black British background.
Muslims are also overrepresented in this segment (16%, average 5%), and correlated to this is overrepresentation of people from Asian and Black backgrounds, which is why they might have more lenient views on multiculturalism and migration. There are average numbers of Hindus, Buddhists and Sikhs.
Traditionalists
The second largest segment, the Traditionalists have negative views about multiculturalism but middling views on non-Muslim minorities. It is one of the more optimistic segments, and also one of the more affluent. Traditionalists are more likely than people in other segments to own their home outright (49% vs. 39%) and describe themselves financially as feeling comfortable or well off. This segment is more male, and more likely to be religious – 59% are Christian, compared to an average of 45%.
Their economic security also offers Traditionalists a positive outlook when it comes to the country and politics. Members of this segment are more likely to see voting as a credible mechanism for change (74% vs. 63%) and trust the government to act in their best interest (41% vs. 25%). 70% feel optimistic about the future, and 39% think life is better now for themselves and their families compared to ten years ago, compared to an average of 25%. Unlike the Islamosceptics and Nativists, who are also anti-multiculturalism, this segment has less of a perception of decline.
However, this segment views immigration as having been bad for the country (71% vs. 55%) and has negative views about Muslims and multiculturalism. Only 29% think that discrimination is a serious problem for Muslims in Britain (average 51%). Like the Islamosceptics, they do not view Jews, Hindus as Sikhs in the same negative light, with views on whether these groups cause problems broadly in line with the average.
When it comes to the LGBTQ+ community, they are more likely to think Lesbian, Gay and Bisexual people (31% vs. 23%) and Trans people (40% vs. 30%) cause problems. 45% actively disagree that people should be able to identify as being of a different gender to the one they had recorded at birth. The traditional values of this segment mean that they are accepting of religious non-Muslim minorities to a greater extent than they are of LGBTQ+ people.
Islamosceptics
This segment is much more likely to be older, and alongside the Nativists has the least ethnic diversity of any segment – 96% are white. Almost a quarter (24%) of this segment voted for Reform UK in the 2024 General Election. Members of this segment are less likely to have educational qualifications beyond degree level, and more likely to be on low incomes.
People in this segment tend to have some of the most negative beliefs about multiculturalism, immigration and Muslims, but have positive or neutral beliefs about non-Muslim minorities. 77% think that Islam poses a serious threat to Western civilisation (average 50%) and 59% agree that the arrival of immigrants has changed their local community for the worse (average 34%). 92% think that immigration into Britain has been a bad thing for the country (average 55%).
However, Islamosceptics are much less likely than average to have negative views of Hindus (0% vs. 16%) and Sikhs (1% vs. 14%). This is surprising, given that they have negative views of Black and minority ethnic people – 42% think that they cause problems. This suggests that their perceptions of ethnic diversity and multiculturalism are primarily shaped by their views on Islam.
They are also more likely than average to agree that progressive activists cause problems, including the “far left” (66% vs. 47%), climate activists (76% vs. 55%) and pro-Palestine campaigners (78% vs. 52%). Their views on the LGBTQ+ community are broadly in line with the average.
The Islamosceptics have some of the lowest trust and optimism: 96% think things are worse for Britain now than they were ten years ago, and they think this trend will continue, with 81% thinking that things will be even worse in ten years’ time.
Nativists
This segment has the most negative views about immigration, multiculturalism and Muslims, as well as non-Muslim minorities. For example, 95% think immigration has been bad for the country, and 83% think having a wide variety of backgrounds and cultures has undermined British culture.
Nativists are overwhelmingly white (96%) and a higher than average proportion did not vote in the most recent General Election (45%). A fifth (22%) voted for Reform. They also have some of the lowest levels of political trust and optimism, with only 28% feeling optimistic about the future, compared to an average of 52%.
Members of this segment are far more likely to have experienced deprivation: four fifths (81%) do not have degree level qualifications, and this segment has the biggest proportion of lower income members. 26% rent their home from the council or local authority, compared to an average of 19%.
Nativists’ experiences of financial hardship and disadvantage appear to shape their views towards politics. 43% consider themselves disadvantaged in society (average 27%), and this is reflected in their financial experiences: they are much more likely to describe themselves as financially desperate (15% vs. 8%). Similarly, 79% think that the British government is rigged to serve the rich and influential (average 59%).
This lack of opportunity is also reflected in perceptions of competition and coexistence between Nativists themselves and immigrants. 57% think that immigrants have made it harder for them to get a fair wage for their work, compared to an average of 34%. 69% agree that the arrival of immigrants has made their local community worse (average 34%) and only 25% agree that they would like to get to know their neighbours better (average 41%).
The segments
Total sample (nationally representative)
| Gender | Age | Ethnicity |
 |  |  |
| Educational qualifications | 2024 General Election vote | Household income |
 |  |  |
Gender
| Multiculturalists | Hyper-progressives | Cherry-pickers |
 |  |  |
| Traditionalists | Islamosceptics | Nativists |
 |  |  |
Age
| Multiculturalists | Hyper-progressives | Cherry-pickers |
 |  |  |
| Traditionalists | Islamosceptics | Nativists |
 |  |  |
Ethnicity
| Multiculturalists | Hyper-progressives | Cherry-pickers |
 |  |  |
| Traditionalists | Islamosceptics | Nativists |
 |  |  |
Education level
| Multiculturalists | Hyper-progressives | Cherry-pickers |
 |  |  |
| Traditionalists | Islamosceptics | Nativists |
 |  |  |
General Election 2024 vote
| Multiculturalists | Hyper-progressives | Cherry-pickers |
 |  |  |
| Traditionalists | Islamosceptics | Nativists |
 |  |  |
Income
| Multiculturalists | Hyper-progressives | Cherry-pickers |
 |  |  |
| Traditionalists | Islamosceptics | Nativists |
 |  |  |
Segmentation methodology
The segmentation is a result of finding factors: indexes of polarising issues where people’s attitudes range across a spectrum. We then take responses to the factors and group them using a technique called Latent Class Analysis. In this case, six groups were found where individual respondents within the group share similar responses to each other on the key questions affecting the factors. By looking at the demographics and attitudes of each segment, we can understand different perspectives across the UK.
The segmentation groups people together based on their alignment with three factors, which were chosen because they reflect polarisation within the data.
The factors are:
Each question included in a factor has either a positive or a negative impact on it (it is either a manifestation of the factor or a reaction against it, but demonstrates strong opinions either way). An example of a negative or positive impact question is given for each of the three factors.
Factor 1 has the most explanatory value of all the factors, accounting for 20% of the overall variance in the data, which is more than twice as much as either Factor 2 (8.5%) and Factor 3 (6.7%). Attitudes to multiculturalism, immigration and Muslims are therefore the most significant input for understanding attitudes more generally.
Originally the 2024 analysis was done with four factors, with multiculturalism/immigration and attitudes to Muslims separated. However, the separation of these factors did not add explanatory value to the segmentation. This demonstrates how perceptions of multiculturalism and immigration are closely tied with perceptions of Muslims in particular, in a way that is not true of other predominantly ethnic minority religions such as Hinduism and Sikhism.
Factor 1: Negative attitude towards multiculturalism, immigration and Muslims
This factor includes questions on British culture, immigration and asylum and Muslims in the UK, as well as general attitudes to anti-racism.
Example questions:
➕Distrust for people who support and campaign for asylum seekers
➖Agreement that immigrants have added richness and variety to British culture
Factor 2: Distrust and pessimism
The questions in this factor pertain to a general distrust and disenfranchisement with the political and media system, as well as pessimism about how things compare now to the past and how they will change in the future.
Example questions:
➕Agree that Britain as a whole is worse now than it was ten years ago
➖Trust in the Government to act in my best interest
Factor 3: Negative attitudes towards non-Muslim groups
This factor includes questions about other groups in society that are not Muslim, including religious groups like Hindus, Sikhs, Jews and Christians, as well as the LGBTQ+ community, including trans people. This factor only has positive impact questions, because all the questions included in the factor measure negative attitudes.
Example questions:
➕Agreeing that Hindus cause a lot of problems in the UK
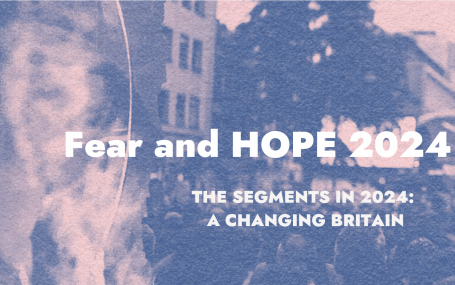
Our latest report identifies the drivers of fear and hope and the triggers that push people from one to the other. This year, we look at 2024 as a pivotal point for the UK, with the General Election in July and riots in August. We look back at the archive of Fear and HOPE reports since 2011, seeing how public attitudes have changed under 14 years of Conservative governments. Download the full report today.

Prefer to listen? Click the play button to hear the audio version. Harry Shukman Reform UK is staffed by oddballs and enigmas, but none odder…